library(tidyverse)
library(broom)
library(gapminder)
data("gapminder")
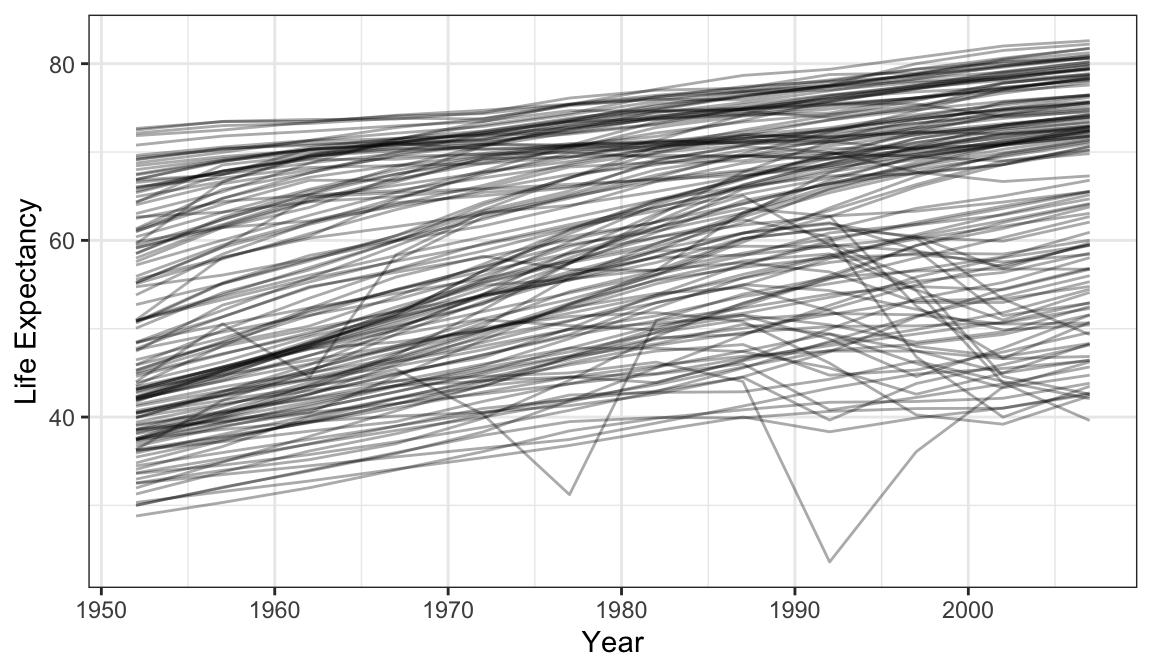
glimpse(gapminder)Rows: 1,704
Columns: 6
$ country <fct> "Afghanistan", "Afghanistan", "Afghanistan", "Afghanistan", …
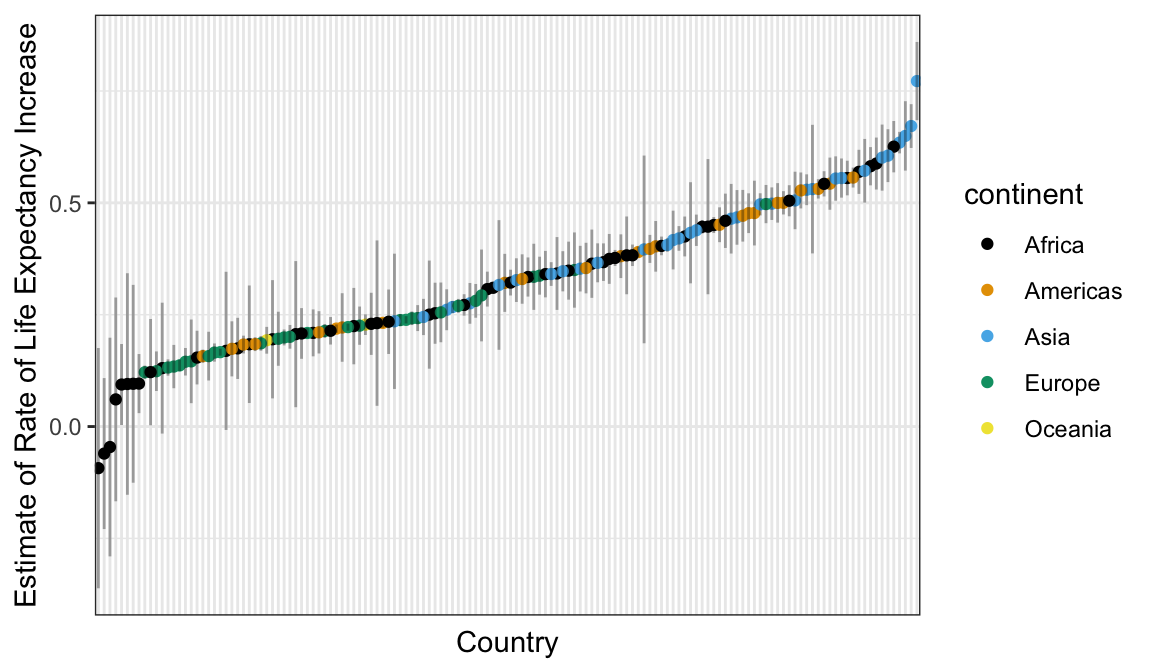
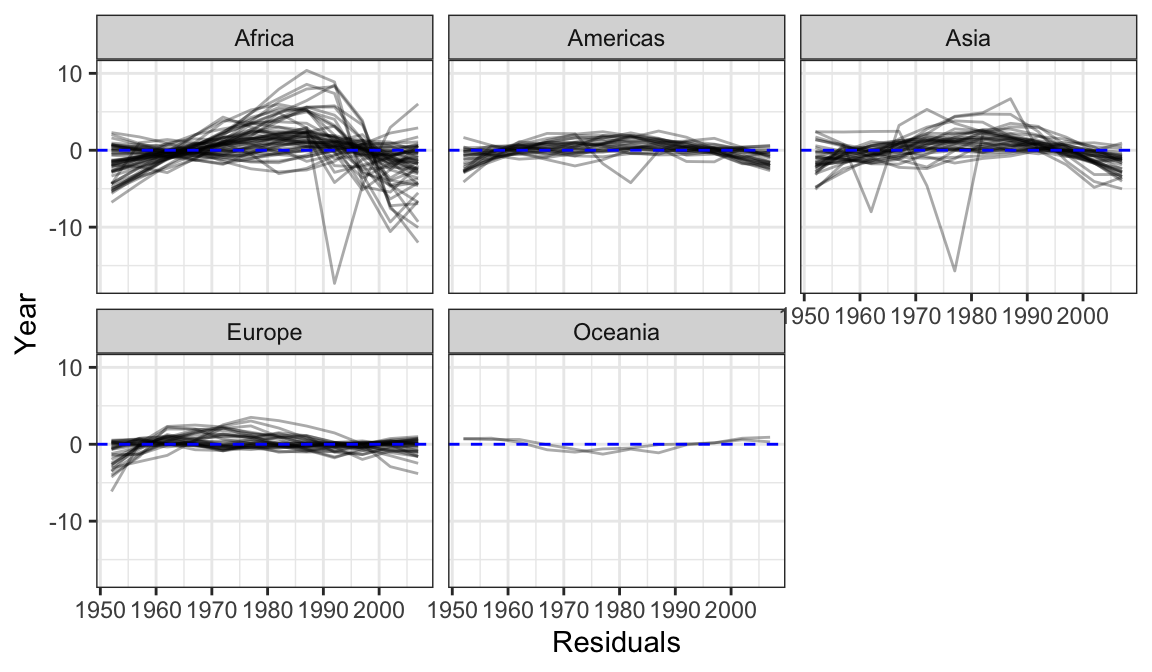
$ continent <fct> Asia, Asia, Asia, Asia, Asia, Asia, Asia, Asia, Asia, Asia, …
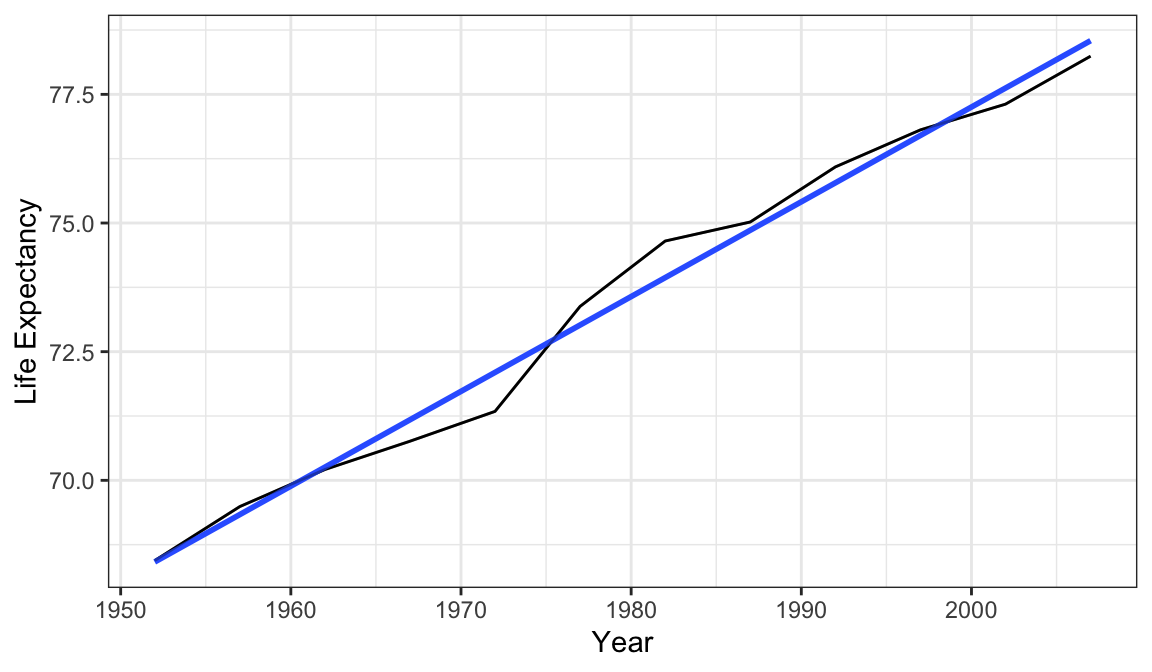
$ year <int> 1952, 1957, 1962, 1967, 1972, 1977, 1982, 1987, 1992, 1997, …
$ lifeExp <dbl> 28.80, 30.33, 32.00, 34.02, 36.09, 38.44, 39.85, 40.82, 41.6…
$ pop <int> 8425333, 9240934, 10267083, 11537966, 13079460, 14880372, 12…
$ gdpPercap <dbl> 779.4, 820.9, 853.1, 836.2, 740.0, 786.1, 978.0, 852.4, 649.…